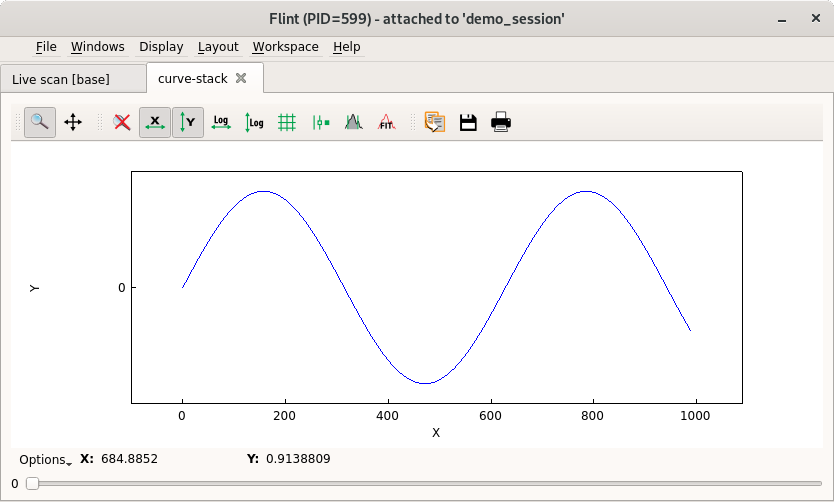
Curve stack
This plot displays a single curve from a selectable list of curves.
The data have to be provided as a 2D array. The slow axis is used as the axis of the curve.
The selection is done with a slider.
Example
import numpy

# Create the plot
f = flint()
p = f.get_plot(plot_class="curvestack", name="My curve stack")

# Create the data and setup the plot
curves = numpy.empty((10, 100))
for i in range(10):
    curves[i] = numpy.sin(numpy.arange(100) / 30 + i * 6)
x = numpy.arange(100) * 10
p.set_data(curves=curves, x=x)