Display data from the shell
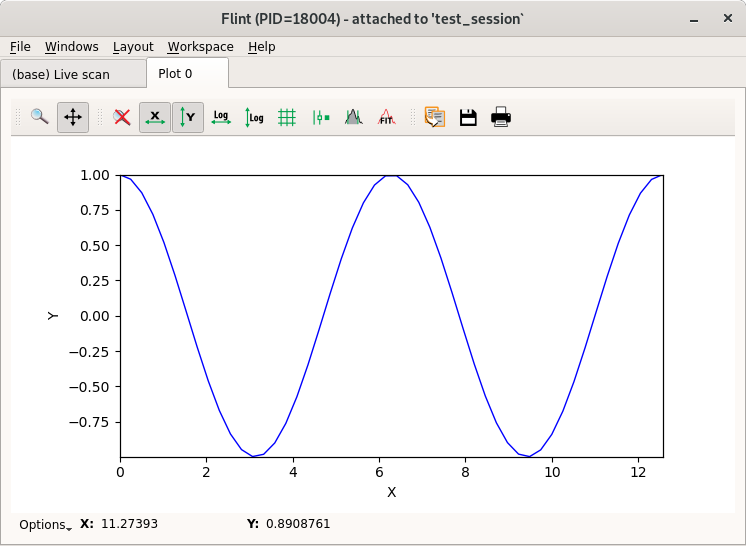
A generic display is provided through the BLISS plot() command.
It checks the data dimensionality to select the kind of charts.
This can be convenient for basic display.
# Display a list (as a single curve using index as x-axis)
plot([1, 2, 3, 1, 2, 3])

import numpy

# Display a 1D data (as a single curve using index as x-axis)
array = numpy.array([1, 2, 3, 1, 2, 3])
plot(array)

# Display a 2D data (as an image)
image = numpy.array([[1, 2, 3], [1, 2, 3], [1, 2, 3]])
plot(image)

# Display a 3D data (as a stack of images)
cube = numpy.arange(1000)
cube.shape = 10, 10, 10
plot(cube)
If that’s not enough take a look at the underlying API: the custom plots.
From scripts
It also can be used from a script.
The plot() command can be imported the following way:
from bliss.common.plot import plot

plot([1, 2, 3, 4, 5, 6])