Flint debugging
Here are few tips in order to ease debugging of BLISS display in Flint.
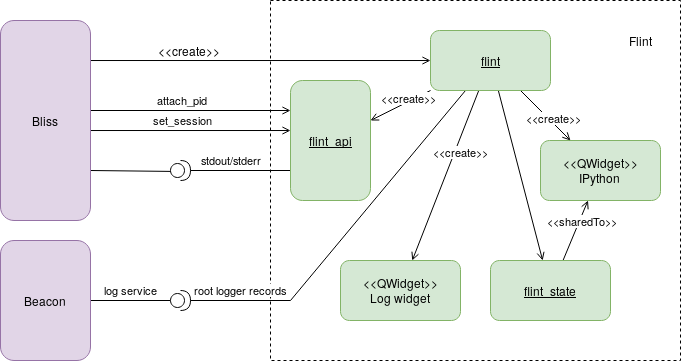
First of all, Flint does not run in the same process than BLISS, it uses it’s own process.
This allows the GUI to segfault without breaking the sequencer. But it can make the debugging a little more complex.
Here is an overview of available solutions to debug problems.
Default beacon logging
By default Flint uses a Beacon service to store logging inside a file.
Beacon will create a dedicated Flint logging per session.
By default the Beacon logging service will create new files for Flint together
with BLISS logging: inside /var/log/bliss/. But logs for Flint are stored
in a dedicated file: /var/log/bliss/flint_{session}.log.
As the beacon service have to be retrieved first, early logging messages are not saved. First the bliss session have to be set to Flint. After than messages are send to the log server.
Logging inside Flint
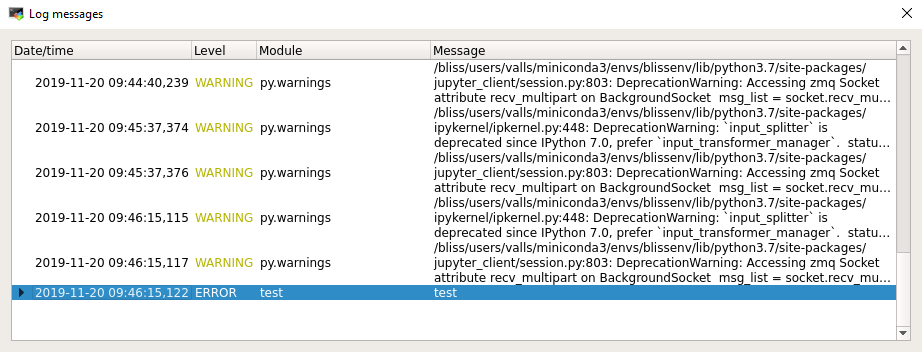
Flint can display logs on a separated window using the standard python logging system. This can catch early messages.
To show Log messages window:
Note
Menu: Windows ▶ Show log.
All the caught exceptions will be displayed there.
Flint stdout/stderr in a console
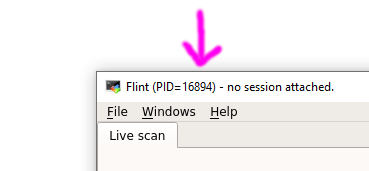
Flint can be create independently and then attached to a BLISS session. This way, early logs can be displayed.
First create flint:
flint -s EH1
The header of the Flint window will display the PID of the process.
This information must be used in order to attach the Flint process to BLISS.
Then, from the BLISS session:
from bliss.common import plot
plot.attach_flint(PID)
Save Flint logs into a specific file
The Flint application support command line argument to specify an extra file in which logs will be saved.
This can be used together with the beacon log service.
flint --log-file myfile.log
It also can be setup from BLISS:
SCAN_DISPLAY.extra_args = ["--log-file", "myfile.log"]
flint()
IPython
Flint also provides an IPython console embedded in the GUI.
To show the console:
Note
Menu: Windows ▶ IPython console.
Note
The console can be detached from the main window to avoid to lose display space.
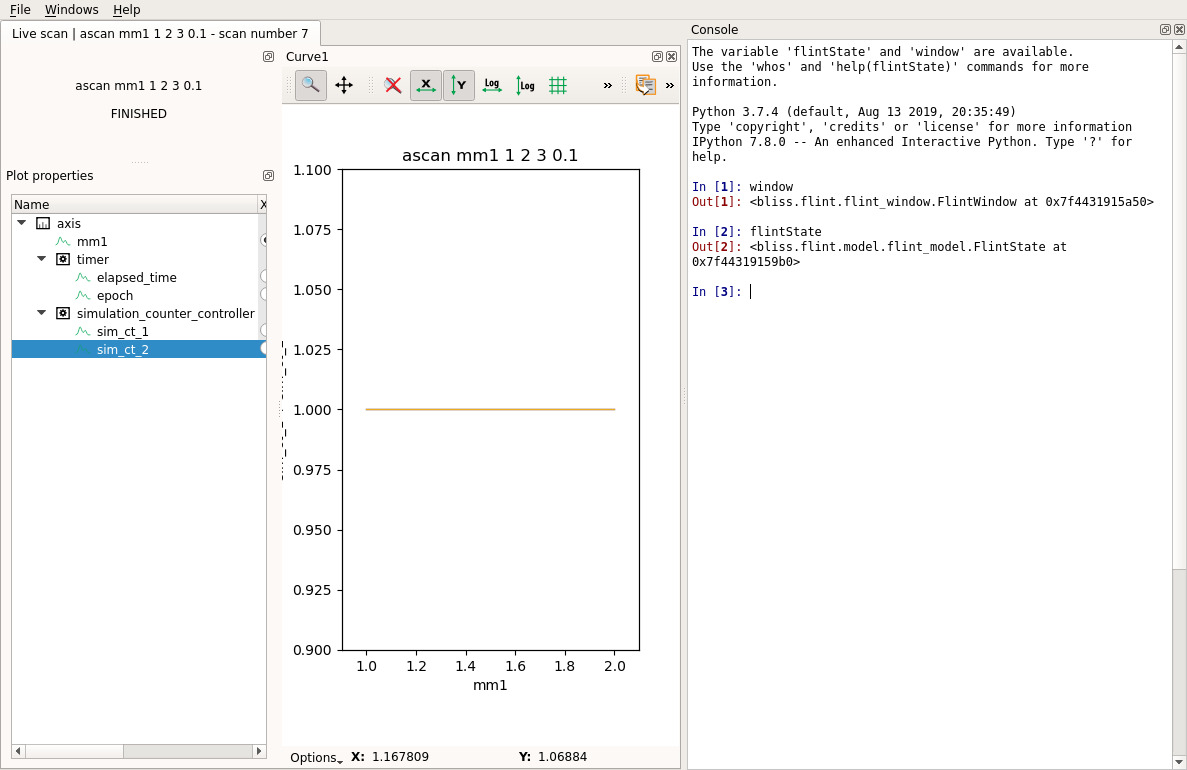
This IPython session contains 2 initial objects:
window: a reference to the main Qt window of Flint.flintState: a reference to all the data and process provided by Flint.
Here is a way to check a channel’s data which was received by Flint:
scan = flintState.currentScan()
channel = scan.getChannelByName("lima_simulator:image")
array = channel.data().array()
# Here we have a numpy array
array.shape
This can be used to check the structure of a plot (a plot is about modelization, not about widget and GUI):
workspace = flintState.workspace()
plots = workspace.plots()
plot = plots[0]
# For a plot of curves, this will list each displayed curves
plot.items()