Grid container
A grid container can be created to structure multiple data plots inside.
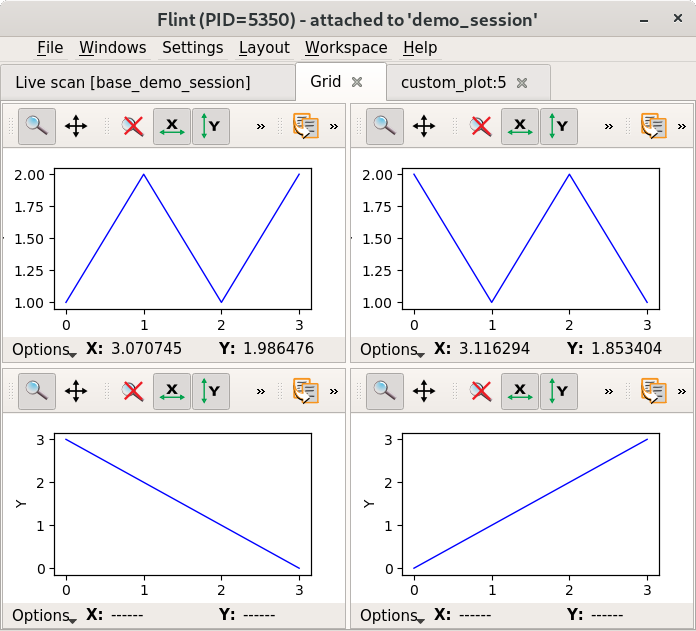
The container provides a get_plot method. Extra arguments can be passed like
row, col, row_span, col_span in order to localize the plot to the grid.
Example
# Create the container
f = flint()
container = f.get_plot("grid", name="Grid", selected=True)

# Create the sub plots
p1 = container.get_plot("curve", row=0, col=0)
p2 = container.get_plot("curve", row=0, col=1)
p3 = container.get_plot("curve", row=1, col=0)
p4 = container.get_plot("curve", row=1, col=1)

# Now you can add data to each plots
p1.add_curve([0, 1, 2, 3], [1, 2, 1, 2])
p2.add_curve([0, 1, 2, 3], [2, 1, 2, 1])
p3.add_curve([0, 1, 2, 3], [3, 2, 1, 0])
p4.add_curve([0, 1, 2, 3], [0, 1, 2, 3])