Examples
Few basic example on how setup a scan to display it properly in Flint.
This is not supposed to by types by users, but wrapped inside meaningful function for scientists.
Scan with a specific x-axis
You could want to specify the x-axis of a scan which differ from the default one.
from bliss.scanning.scan_info import ScanInfo
scan_info = ScanInfo()

# Specify the diode1 as the x-axis
scan_info.add_curve_plot(x=diode1.fullname)
ascan(sx, 0,1,10,0.1,diode1, diode2, scan_info=scan_info)
Scan with multiple scatter plots
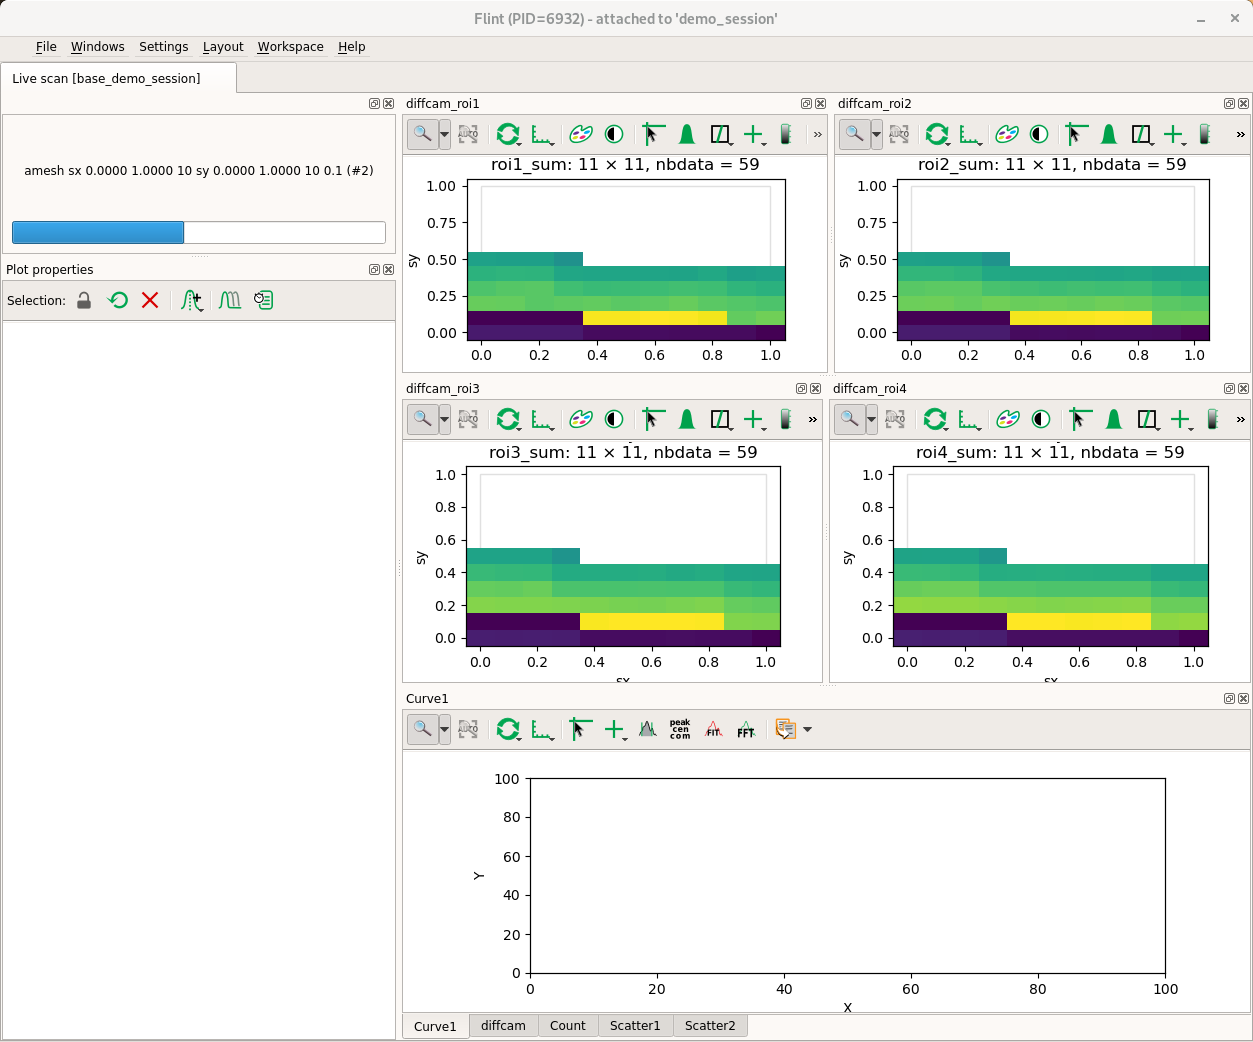
# Setup a camera with some ROIs
diffcam.roi_counters["roi1"] = 10,10,50,50
diffcam.roi_counters["roi2"] = 20,20,60,60
diffcam.roi_counters["roi3"] = 30,30,70,70
diffcam.roi_counters["roi4"] = 40,40,80,80

# Check the ROIs location
ct(diffcam)

# Describe a plot per ROIs, with a pre selection
from bliss.scanning.scan_info import ScanInfo
scan_info = ScanInfo()
scan_info.add_scatter_plot(name=f"diffcam_roi1", x=sx.fullname, y=sy.fullname,
                           value=diffcam.roi_counters.counters.roi1_sum.fullname)
scan_info.add_scatter_plot(name=f"diffcam_roi2", x=sx.fullname, y=sy.fullname,
                           value=diffcam.roi_counters.counters.roi2_sum.fullname)
scan_info.add_scatter_plot(name=f"diffcam_roi3", x=sx.fullname, y=sy.fullname,
                           value=diffcam.roi_counters.counters.roi3_sum.fullname)
scan_info.add_scatter_plot(name=f"diffcam_roi4", x=sx.fullname, y=sy.fullname,
                           value=diffcam.roi_counters.counters.roi4_sum.fullname)

amesh(sx, 0,1,10,sy, 0,1,10,0.1, diffcam, scan_info=scan_info)
Sequence containing displayed sub scans
For now it is important to add a scan to a sequence before running it.
Else it is considered as a parallel scan and the display could be ignored.
from bliss.scanning.group import Sequence

flint()

seq = Sequence()
with seq.sequence_context() as scan_seq:
    for i in range(10):
        s = ct(tomocam, run=False)
        # The scan have to be added to the sequence before the run
        scan_seq.add(s)
        s.run()
Sequence with progress bar
Flint can follow the number of subscans, it can be specified
from bliss.scanning.group import Sequence
from bliss.scanning.scan_info import ScanInfo

scan_info = ScanInfo()
# You have designed the scan, you know how much child scan it will contains
scan_info.set_sequence_info(scan_count=10)

seq = Sequence(scan_info=scan_info)
with seq.sequence_context() as scan_seq:
    for i in range(10):
        s = ct(tomocam, run=False)
        scan_seq.add(s)
        s.run()