Time curve
A dedicated plot is provided to display curve data with time as x-axis.
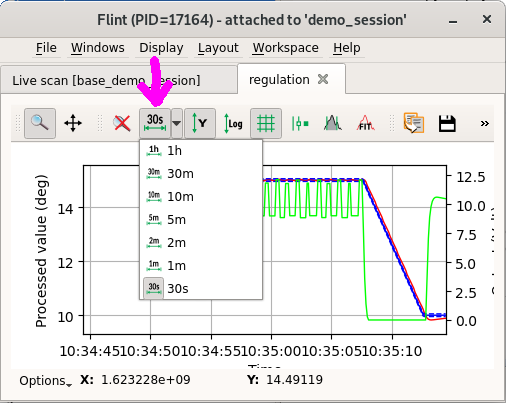
It’s the plot used by the regulation framework.
This is useful to simplify the display of a fixed period of time (the last x seconds), and to update the data using the new known data only.
Handling of the time
The UI allow the user to change the last displayed period of time displayed, and the time of life of the data.
With this user selection, Flint handle the time of life of the data, removing the old data from the memory.
Notice that the data for the time have to be named time, and have to be in
second.
Example
# Create the plot
f = flint()
p = f.get_plot(plot_class="timecurveplot", name="My plot")

# Setup the plot to display a dedicated data name
# The data will be provided later
# the `time` data name is used as x-axis
p.add_time_curve_item("diode1")
# The curve style can be specified
p.add_time_curve_item("diode2", color="red")

# The data can be set
# The time have to be provided in epoch second UTC (see python API `time.time()`)
p.set_data(time=[0, 1, 2], diode1=[0, 1, 1], diode2=[1, 5, 1])

# The data also can be appended
# That's the default way to interact with
p.append_data(time=[3], diode1=[2], diode2=[6])

# And data can be cleared
p.clear_data()
APIs
Axis selection
The time axis can be set programmatically.
p.select_x_duration(second=5)