Custom plot class
Flint allows to define an own custom Qt chart.
The following example will show how to embed your own matplotlib
plot inside Flint. But any other library using PyQt (like silx) could be used.
Warning
As this code will probably be designed at a beamline, be careful to only use it if nothing else really match. It’s probably better to improve the other existing charts, or to ask to merge that new code inside Flint at some point.
Create your Qt widget
This module have to be reachable by Flint but must not be imported by BLISS or any of your scripts.
I have created this file inside bliss.git/bliss/my_plot_in_bliss.py, but you
should create it inside your beamline lib imported by BLISS.
import logging
import time

from silx.gui import qt
from silx.gui.utils.matplotlib import FigureCanvasQTAgg
from matplotlib.figure import Figure

_logger = logging.getLogger(__name__)


class MyPlotInFlint(qt.QWidget):
    """
    This class describe the plot inside Flint.

    It's the only one which have to handle Qt and matplotlib.

    It must not be imported by BLISS or any of your scripts.
    """

    def __init__(self, parent=None):
        super(MyPlotInFlint, self).__init__(parent=parent)

        fig = Figure()
        self._ax = fig.add_subplot(111)

        self.__plot = FigureCanvasQTAgg(fig)
        self.__plot.setParent(self)

        layout = qt.QVBoxLayout(self)
        layout.addWidget(self.__plot)

        # Your own attributes
        self._x = None
        self._y = None
        self._lastUpdate = None

    #
    # Your own API
    #

    def clear(self):
        self._lastUpdate = None
        self._ax.clear()

    def setData(self, x, y):
        self._lastUpdate = time.time()

        # Try-except to make sure no exception will be returned in BLISS
        # But instead logged inside Flint
        try:
            self._updatePlot(x, y)
        except Exception:
            _logger.critical("Error while updating the plot", exc_info=True)

    def getLastUpdate(self):
        return self._lastUpdate

    def _updatePlot(self, x, y):
        self._ax.plot(x, y)
        self._ax.grid(True)
        self._ax.set_xlabel("X")
        self._ax.set_ylabel("Y")

        self.__plot.draw()
Create custom BLISS proxy
This module has to be reachable by BLISS and it is better not to import it in Flint.
For this example, the file is created in bliss.git/bliss/my_plot_in_flint.py.
But it should be in beamline library imported by BLISS.
WIDGET attribute has to be updated according to the location of Qt module.
from flint.client.plots import BasePlot


class MyPlotInBliss(BasePlot):
    """This class provides the API which is exposed by BLISS.

    It is basically a proxy to the real plot in Flint.
    """

    WIDGET = "bliss.my_plot_in_flint.MyPlotInFlint"
    """Qualified name of the plot living in Flint"""

    def clear_data(self):
        """You can define methods
        """
        # The submit is rused to call the real method of the plot in FLint
        self.submit("clear")

    def set_data(self, x, y):
        """
        Methods can pass arguments.

        Everything will be pickled (standard Python serialization library),
        including numpy arrays.
        """

        # Usually we use snake case in BLISS side, and camel case in Flint/Qt side
        # But it's up to you.

        self.submit("setData", x, y)

    def get_last_update(self):
        """
        Methods can also return values.

        Which will also be pickled (standard Python serialization library).
        """
        return self.submit("getLastUpdate")
Use the plot
This plot can be used after restart of BLISS and FLint.
# Create the plot
f = flint()
from bliss.my_plot_in_bliss import MyPlotInBliss
p = f.get_plot(MyPlotInBliss,
name="My plot",
unique_name="MyPlot0001",
selected=True)
# Use the plot API
p.clear_data()
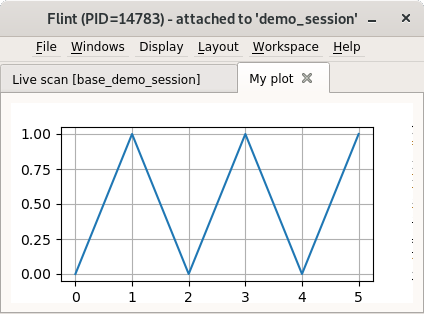
p.set_data([0,1,2,3,4,5],[0,1,0,1,0,1])
print(p.get_last_update())