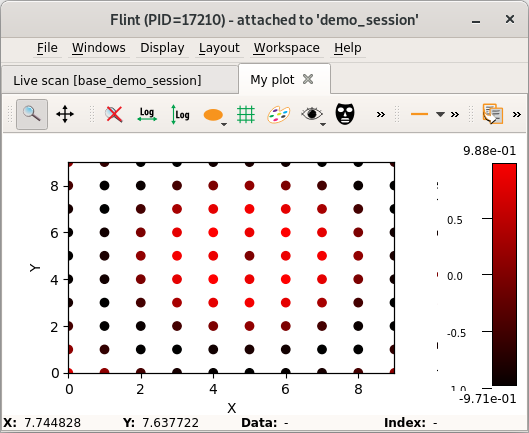
Scatter
A dedicated plot for scatter 2D data is provided.
A 2D scatter is a group of three 1D data of the same length. Each element respectively contains x-locations, y-locations and values.
The widget provides different visualization mode to display the data as points, or with a solid rendering, including 2D histogram rendering.
Example
import numpy

# Create the plot
f = flint()
p = f.get_plot("scatter", name="My plot")

# Create the data and setup the plot
y, x = numpy.ogrid[:10, :10]
x, y = numpy.zeros_like(y) + x, numpy.zeros_like(x) + y
x, y = x.flatten(), y.flatten()
v = numpy.sin(numpy.sqrt((x-5)**2 + (y-5)**2))
p.set_data(x, y, v)

# The colormap can be updated
p.set_colormap(lut="red")