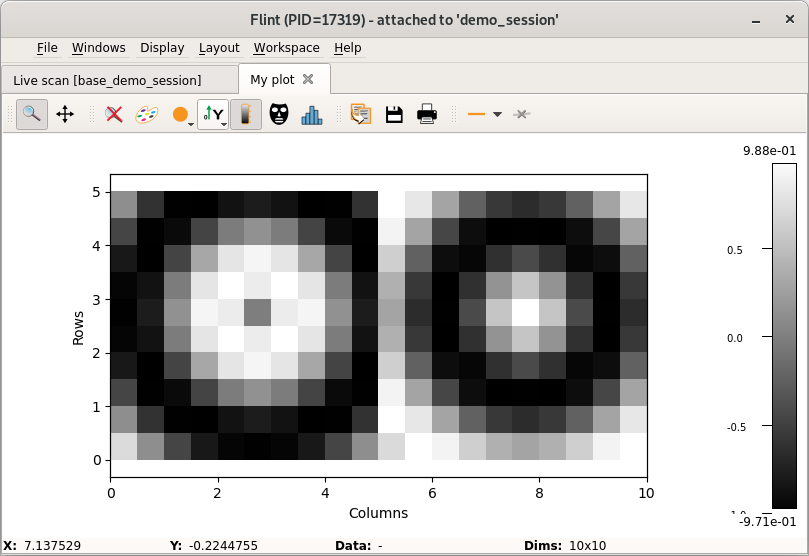
2D plot
This is a plot for general 2D use case.
It is provided to compose a view with many images. But provides less tools than the dedicated image plot.
Example
import numpy

# Create the plot
f = flint()
p = f.get_plot("plot2d", name="My plot")

# Create the data and setup the plot
y, x = numpy.ogrid[:10, :10]
image1 = numpy.sin(numpy.sqrt((x-5)**2 + (y-5)**2))
image2 = numpy.cos(numpy.sqrt((x-5)**2 + (y-5)**2))
p.add_image(image1, origin=(0, 0), scale=(0.5, 0.5), legend="img1")  # legend have to be unique
p.add_image(image2, origin=(5, 0), scale=(0.5, 0.5), legend="img2")

# Clean up the plot
p.clean_data()
Scatter
import numpy

# Create the plot
f = flint()
p = f.get_plot("plot2d", name="My plot")

p.add_colormap("col1", lut="viridis")

value = numpy.array([1, 2, 3, 4])
x = numpy.array([1, 2.5, 3, 3.5])
y = numpy.array([3, 4, 5, 6])
p.add_scatter(x=x, y=y, value=value, legend="img2", colormap="col1")
Image with normalization
import numpy

# Create the plot
f = flint()
p = f.get_plot("plot2d", name="My plot")

p.add_colormap("col1", lut="viridis")

image = numpy.array([[1, 2, 3, 4], [3, 4, 5, 6]])
x = numpy.array([1, 2.5, 3, 3.5])
y = numpy.array([3, 4])
p.add_image_with_normalization(image, x_axis=x, y_axis=y, legend="img2", colormap="col1")