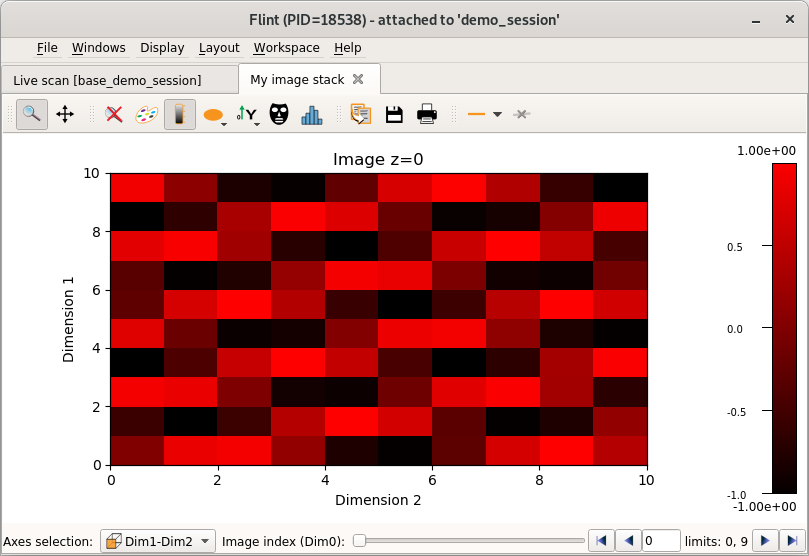
Image stack
This plot displays a single image from a stack of image.
The data have to be provided as a 3D array. The 2 first slow axis are used as the image axes.
A slider is provided to browse the images.
Example
import numpy

# Create the plot
f = flint()
p = f.get_plot(plot_class="stackview", name="My image stack")

# Create the data and setup the plot
cube = numpy.arange(10 * 10 * 10)
cube.shape = 10, 10, 10
cube = numpy.sin(cube)
p.set_data(cube)

# The colormap can be updated
p.set_colormap(lut="red")