Live image
For scans containing image data, the image widget will be displayed automatically.
A specific widget is created per image channel, usually one per detector.
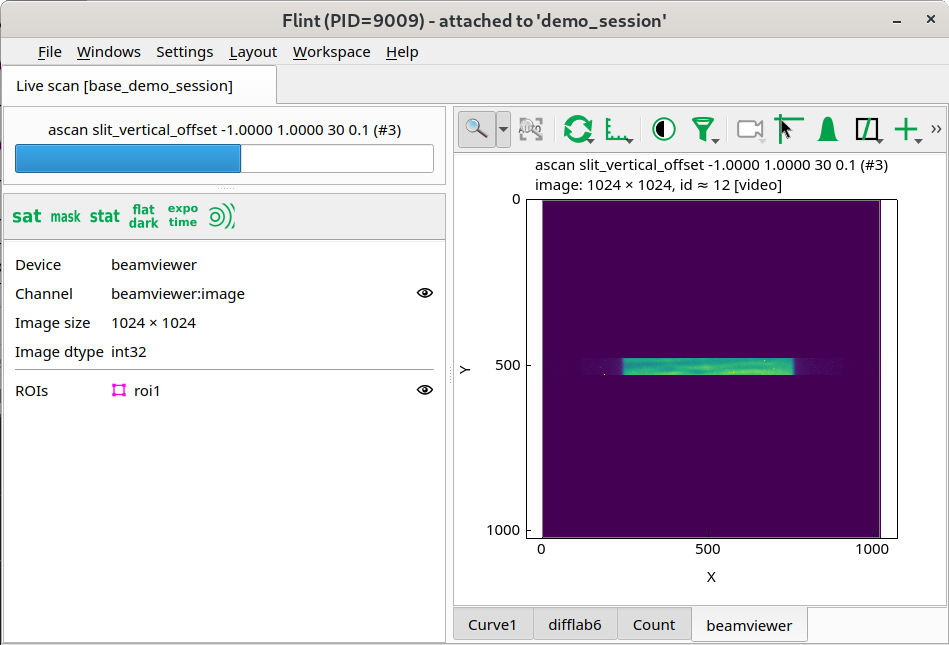
Only the last retrieved data from the detector will be displayed. There is no way for now to browse the data from a scan.
To follow the evolution of an indicator in the time, it is possible to create first ROIs (see editing Lima ROIs), and then acquiring a scan on it. The data will be then displayed in the default curve plot.
Property view
The property view displays basic information of the channel, and provides a set of light data processing that can be enabled to improve the display.
It’s a set of filters targetting different use cases like, flatfield correction, mask removal, normalization by exposition time… See for example the diffraction overlay bellow.
Diffraction overlay
If pyFAI is installed, a diffraction overlay can be displayed.
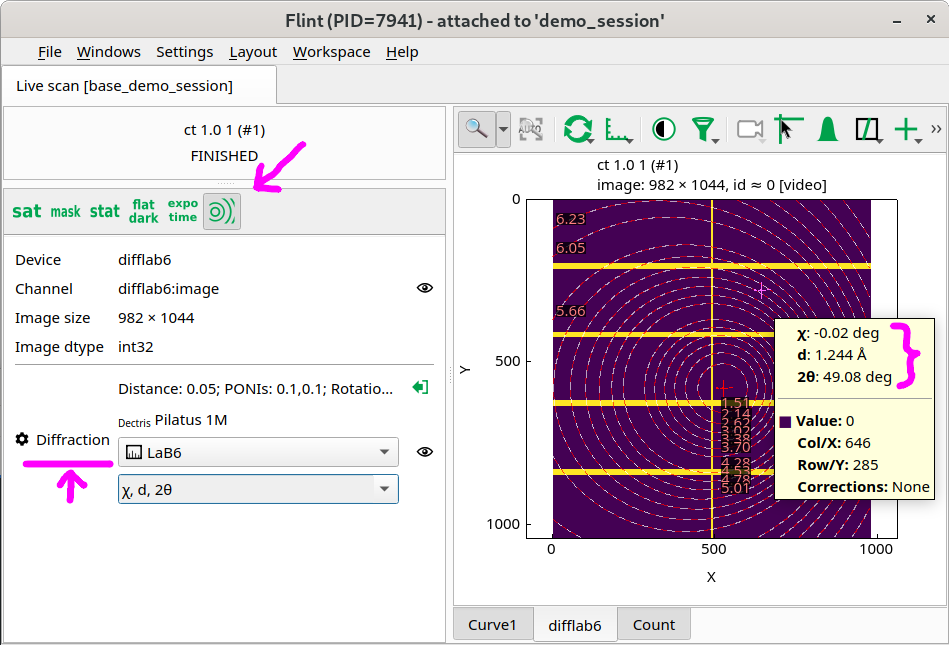
This allow to:
- Show/edit the diffraction geometry in the user interface
- Display the theorical location of the beam center and the rings
- Show extra coordinates in the image tooltip
- Edit arc ROIs with the diffraction geometry
- Edit the diffraction geometry from the BLISS shell
This feature can be tested with the BLISS demo session the following way:
f = flint()
p = f.get_live_plot(difflab6)
p.diffraction.set_detector("Pilatus1M")
p.diffraction.set_calibrant("LaB6")
p.diffraction.set_geometry(
    wavelength=0.000000000103321,       # in meter
    dist=0.05,                          # in meter
    poni1=0.1,                          # in meter
    poni2=0.1,                          # in meter
    rot1=0.17453292519943295,           # in radian
    rot2=0,                             # in radian
    rot3=0,                             # in radian
)

ct(difflab6)
APIs
Here is the available commands which can be used from the BLISS shell.
Get the plot
The plot is reachable using the BLISS name of the detector.
f = flint()
ct(tomocam)
f.wait_end_of_scans()

p = f.get_live_plot(tomocam)
Interactive data selection
This plot provides an API to interact with region of interest.
Colormap
An API is provided to custom the colormap.
ct(tomocam)

# Make sure the scan was also completed in flint side
f = flint()
ct(tomocam)
f.wait_end_of_scans()

p = f.get_live_plot(tomocam)

p.set_colormap(lut="gray",
               vmin=0, vmax="auto",
               normalization="log",
               autoscale_mode="stddev3")
Logbook
p.export_to_logbook()
Markers
A marker API is provider to create/update/remove permanent markers.
This markers are controller by BLISS and are persistent. Which is not the case for the interaction API also provided.
If this markers are editable (which is the default), the user can move them
manually with the mouse.
The user can also remove them using the GUI (this could be protected in the future, if requested by beamlines).
# Get a live plot
f = flint()
f.wait_end_of_scans()
ct(tomocam)
p = f.get_live_plot(tomocam)

# Create a marker
p.update_marker("my-marker-id", (10, 11), editable=False, text="Hi mom!")

# Move a marker
p.update_marker("my-marker-id", (20, 21))

# Print the actual location of the marker
pos = p.marker_position("my-marker-id")
print(f"x-pos {pos[0]} and y-pos {pos[1]}")

# Remove a marker
p.remove_marker("my-marker-id")
Lima ROI edition
A live image widget is usually linked to a 2D Lima detector.
This widget will became the place to edit the ROIs of this detector if it triggered.
Data processing
The image viewer provides few filters to normalize the image data in Flint side.
Some of the API can be reachable from a processing property.
# Get a live plot
p = f.get_live_plot(tomocam)

# Create a dummy data
import numpy
data = numpy.zeros((1024, 1024))

# Update the mask used to exclud pixels from the contrast computation
p.processing.set_mask(data)

# Update the filter used for flatfield correction
p.processing.set_dark(data, expotime=1.0)
p.processing.set_flat(data, expotime=2.0)